The agent loop that shipped a 5.4x speedup
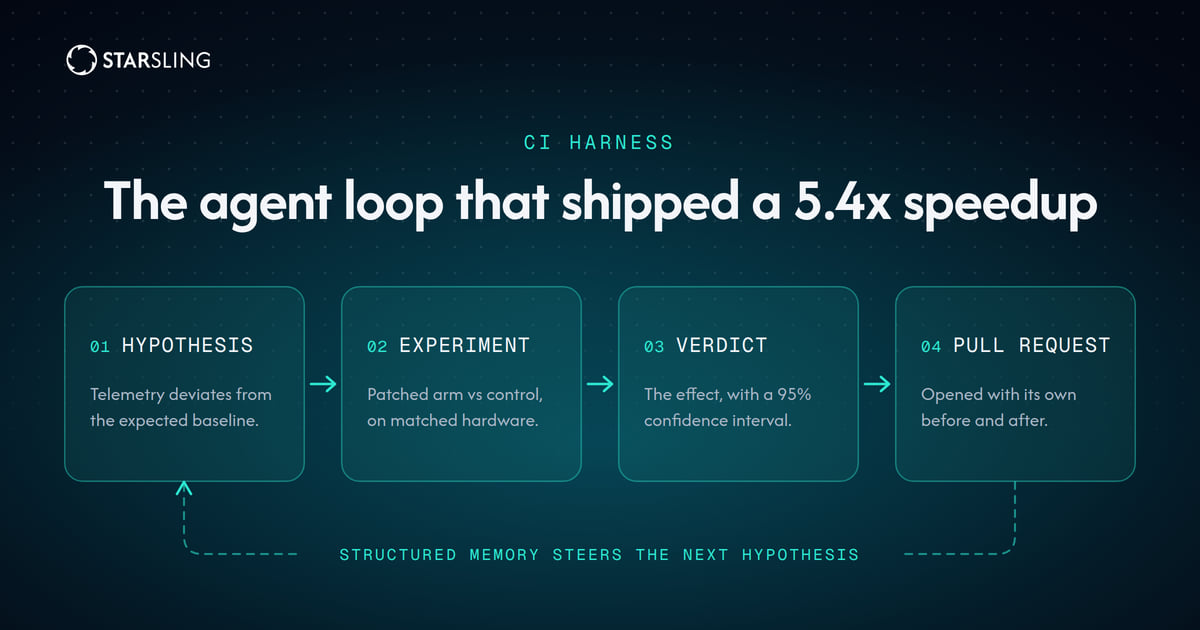
Today we're announcing StarSling CI Harness v2. It is more intelligent, more creative, and produces fewer false positives.
The first thing our new optimization harness found was an 11-month-old performance bottleneck hiding in the test suite of better-auth, the popular TypeScript auth framework. The fix made a key test job 5.4× faster. The job was green the whole time. The logs were clean.
The first find · better-auth · mongo-adapter · 349 tests
Before 24.3 s
After 4.5 s
5.4×
faster
−81.5%
[−98.0, −65.1] 95% CI
better-auth#10762, merged
We rebuilt StarSling's agent and harness architecture around one idea: agents perform better when they think like a real performance engineer.
StarSling's CI harness continuously scans a customer's CI workflows and sends a swarm of agents after the hypotheses it forms. Each agent explores further because it carries a single hypothesis. And the verification loop holds up because agents measure every candidate optimization on the same ephemeral StarSling Runners that serve production traffic.
Early on, we treated finding CI optimizations as a context and data problem. Frontier models are already capable reasoning engines. Give one enough CI data, I assumed, and it would surface the optimizations on its own. It kept coming up empty.
The raw logs for a single job run past 10,000 lines, which dilutes attention and can exhaust the context window. So I added tenant-scoped SQL tools, which gave the agent a far more expressive way to navigate logs. The reasoning got sharper and the conclusions stayed textbook. The agent would name a plausible cause and stop there.
The turning point came during a one-on-one with Daniel, who spent years as a performance engineer at Netflix. I asked him how a performance engineer actually hunts a CI problem.
The answer was in how he reads a profile. When he sees how long a step took, he already holds an expectation for how long that step should take. The moment reality and expectation diverge, he knows something is hiding there, and he starts digging.
So I gave the agent that instinct, in two changes:
- Domain baselines in the system prompt, drawn from the hundreds of thousands of jobs StarSling processes, so the agent operates with a performance engineer's intuition for what normal looks like.
- A tool to check its expectation against observed reality, so a hunch becomes a measurement the agent can act on.
The change in behavior was immediate. Facing a job that took 1,773 seconds, the
agent first stated its expectation, that a checkout should take tens of seconds,
then chased the deviation and found the answer buried nine thousand lines deep:
git fetch had silently hung for 28 minutes.
The agent could now investigate deeply and generate creative hypotheses. Whether a change actually makes CI faster is a separate question, and only a real experiment answers it.
When an agent mutates a GitHub Actions workflow to run 4 parallel shards instead of 2, does the build get faster? Often it gets slower: runner disk I/O chokes, network bandwidth saturates, and VM spinup overhead eats the gain. Our own sandbox benchmarks put a number on how far apart two environments sit on exactly these dimensions: a 7.4× spread in disk IOPS between two products from the same vendor. Performance work has to be measured on the machines that will run it.
Our harness proves that a proposed change delivers the gain it predicts, in the environment production uses. The agent decides where to look, then the harness decides what's true.
The harness loop · many hypotheses, running in parallel
-
01
Hypothesis
The agent reads telemetry, finds a step that deviates from the baseline it expects, and proposes one candidate patch: workflow config, compiler flags, sharding, cache keys.
-
02
Ephemeral experiment
The harness spins up clean, isolated StarSling Runners and executes the patched arm against the control arm, side by side on matched hardware.
-
03
Statistical verdict
Wall-clock duration, CPU utilization, disk I/O and memory pressure, measured across repeated pairs. The effect comes back with a confidence interval attached.
-
04
Pull request
An effect that survives validation becomes a PR carrying its own evidence: the job it speeds up, the measured before and after, and the interval behind the number.
Structured memory back to 01
How far each path was explored, the telemetry observed, and the statistical confidence, all carried into the next hypothesis and shared across every agent working the same repository.
The four stages run as an automated closed loop, continuously and in parallel. An agent can refine a hypothesis against a failed benchmark until it either proves a statistically significant speedup or exhausts the search path. An agent working one hypothesis can also turn up context that sharpens another agent's hypothesis about the same codebase.
On the first run, I expected the system to produce hypotheses and little else. That alone would have told me the wiring worked. So I left it running over the weekend.
When I came back on Monday, the harness had found a real optimization in better-auth's repository. I was thrilled and doubtful in equal measure.
After validation, it held up.
The patch was a dozen lines. The fastest job came out 5.4× faster. The most exciting part is that the bottleneck is invisible at a glance, in the CI logs and in the codebase alike: an 11-month-old architectural friction point in how the test database cleanup was configured, where the k-th cleanup reissued deletes for every row the first k tests had created. The previous generation of our agent loop, with the same CI skills, had walked past it.
| Adapter suite | Tests | Baseline | Patched | Speedup | Change [95% CI] |
|---|---|---|---|---|---|
| mongo-adapter | 349 | 24.3 s | 4.5 s | 5.4× | −81.5% [−98.0, −65.1] |
| kysely-prisma-adapter | 2,903 | 145.6 s | 45.7 s | 3.2× | −68.6% [−76.2, −61.0] |
| prisma-adapter | 1,365 | 287.0 s | 170.6 s | 1.7× | −40.6% [−49.2, −31.9] |
| drizzle-adapter | 1,375 | 185.5 s | 156.7 s | 1.2× | −15.6% [−25.3, −5.8] |
Every arm measured on StarSling Runners. better-auth#10762, merged.
Over the following week the harness opened three more against the same repository. All four, and the job each one speeds up:
| PR | What the harness found | Job | Before → After | Speedup |
|---|---|---|---|---|
| #10762 | Cleanup re-deleted rows that were already gone | mongo-adapter | 24.3 s → 4.5 s | 5.4× |
| #10879 | Tests hashed passwords with the production KDF | test (22.x) | 359.3 s → 296.4 s | 1.21× |
| #10850 | Every e2e launch re-resolved drizzle-kit | drizzle adapter e2e | 220.0 s → 190.1 s | 1.16× |
| #10851 | Every run rebuilt the Prisma schema from scratch | prisma-adapter integration | 315.8 s → 286.3 s | 1.10× |
Four PRs opened between August 11 and August 19, 2026. better-auth runs its CI on StarSling Runners; see their results.
A single job's raw log runs past 10,000 lines, and an agent that reads them end to end spends its context before it reaches a hypothesis. Every webhook delivery and every job log we ingest lands in ClickHouse as typed rows, down to one row per log line, so the agent's forensics tools are SQL. The drill from "which jobs cost this repository the most" to "which step of this run" is four queries, and any two facts can be joined in one more. Deduplication is a property of the table itself, so a webhook GitHub delivers twice converges to one row.
A new frontier model lands every few weeks and each one is a candidate for this
work. A harness that names its provider in code turns every trial into a code
change. To solve for this, the agent is built on
Mastra's Agent primitive, and the model it runs,
currently openai/gpt-5.6-sol, is a provider/model router string read from an
environment variable, so the provider name lives in exactly one place and a
trial is an environment edit.
That is also what lets us A/B the harness. Holding the model constant while the loop around it changes is how we tell which of the two moved a result.
Some hypotheses need the source and most do not. Booting a microVM sandbox for every run pays for a machine a telemetry-only run never touches, and the runs that do need one need the tree at the exact commit that produced the numbers they are reading. So the sandbox is ephemeral and cloned at that commit, and the boot is lazy and single-flight: it happens on the first file the agent opens, so a run that reasons only over telemetry never creates one, and a run that opens fifty files shares one.
The agent reads that tree through Mastra's Workspace tools, and only the reading
half of that surface is ever registered. Registering a write tool would spend
one of the agent's limited steps on a call that could only fail, and the failure
carries nothing that would tell the model the tool was never usable. Underneath,
the checkout is read-only at the filesystem level, so an accidental write fails
at the line that attempts it and the two hold independently. That sandbox also
gives a candidate its first check: before a proposal leaves the agent, its diff
runs git apply --check against the pinned tree, so one that will not apply
comes back while the agent still has the context to repair it.
A verdict decides whether a patch reaches a customer's repository, and someone asks why months later, when the runners that produced it are long gone. So the ledger keeps the facts underneath it in ClickHouse, per replicate: both arms' measured seconds, the per-step timings, and every gate the candidate was checked against. Every row is parsed against an arktype schema on the way in, where a verdict claiming a win with no measurements behind it is unrepresentable, since a malformed row reads as an ordinary one by the time anyone comes back to it. The engine reading them is a set of pure functions, no clock, no database, no network. It is handed the measured facts of both arms and returns one categorical outcome plus the gate that decided it, so re-running it over the stored rows years later reaches the same verdict from the same evidence.
The statistical bar comes from a replication audit on our benchmark harness. Of 13 patches that had been confirmed on a single pair of runs, none survived ten replicates, and several reversed sign. So a screening pair now buys a candidate one thing, promotion to confirmation. A win takes at least three usable replicates per arm, a Welch 95% confidence interval on the mean delta that excludes zero, and evidence that both arms ran the same tests.
A campaign runs many rounds against one repository with nobody watching, which makes crash recovery a design problem before it is an operational one. Each campaign is one durable Hatchet run with its rounds looping inside it. We built the obvious shape first, a chain where each round starts its successor, and it deadlocks: the parent stays blocked on the child it spawned, and a concurrency key then lets that successor cancel the parent that started it. The worker itself runs as a persistent service on Render, because it holds an open connection to the queue it pulls from and a serverless slot would drop that connection between invocations.
Early on I was reading the agent's reasoning traces across twenty consecutive rounds of optimization on an internal repository. There was a particular test-sharding strategy that any human engineer would have treated as the obvious next avenue. The agent never went near it.
The trace explained why. The agent was being steered by its own memory: one experiment had failed because of a flaky package manager, and the agent had written that outcome down as "this path doesn't work." An outlier had quietly become a rule.
Give an agent the power to save freeform conclusions and it will encode transient environmental noise as a fundamental truth about the system. So the harness structures memory around the empirical evidence: how far a path was explored, the telemetry observed, and the statistical confidence attached to it. A single failed run now reads as a single failed run.
During an early test run, the new harness went twenty-four rounds without producing anything meaningful. My first instinct was to rewrite the system prompt.
Before doing that, I went back to the reasoning trace in Honeycomb, where every run's spans and the messages behind them land. The model kept saying the same thing, round after round:
“I can't find what I'm looking for.”
It was choosing the right tools for exploring CI logs. What it wanted sat just past the boundary of what those tools exposed, so it kept probing the places it could see, taking detours and spending tokens on them.
I started pulling the behavior patterns out of the traces and redesigned the tools to express the paths the model kept trying to take. Same task, new tools: it found things it had never reached before, with fewer tool calls and fewer tokens. The tools we ship in the sling CLI and the ci-speedup skill came out of the same exercise: reading what an agent reaches for, then building that.
Some verdicts would not replicate. One proposal screened at 17% faster. After 20 validation runs, the same patch measured 9% slower, with a confidence interval wide enough to drive a truck through.
The runtime of a CPU-bound task is supposed to land in a Gaussian around a mean. This did not. It was bimodal: two distinct clusters with a gap between them, and that shape has only one honest reading. The experiments had landed on machines with different performance characteristics. That was a surprise, because we benchmark our sandbox providers hard (the numbers are published in our results explorer, and the harnesses behind them are open source), and we pick the fastest and most reliable of them for StarSling Runners.
Job duration across the fleet · same commit, same tier, same region
Before runs A and B
faster slower
Two clusters. Host CPU spread reached 1.64× inside a single run, so which cluster an arm drew decided the verdict.
After run C, post-fix
faster slower
One cluster, the tightest fleet spread we have measured. Both arms draw comparable hardware, so the A/B measures the patch.
The same patch, measured twice
Screening
17% faster
One pair of runs, machines drawn at random from the fleet above.
Validated
9% slower
The same patch over 20 runs, with an interval wide enough to drive a truck through.
Working with one of our infrastructure providers, we traced the variance to CPU scheduling on their side. After their fix, we expanded the harness with two layers of validation that now run before any PR reaches a customer:
- Statistical validation of the test environment, confirming the machines an experiment drew perform uniformly.
- Large-scale experimental validation of the optimization, over enough paired runs for the interval to mean something.
This project convinced me that harness engineering is unbounded. The breakthroughs available today do not depend on the next frontier model. What a model lacks is the intuition for what normal looks like in a specific project on specific hardware, and the apparatus to run the scientific method against it. Both of those are ours to build.
The new StarSling CI Harness is generally available today for any GitHub Actions workflow running on a StarSling Runners paid plan. It carries a performance engineer's instincts, and it goes deeper on the low-level telemetry the runners already collect.