Results Explorer and Updates for High Performance Sandbox Benchmarks
TL;DR: We've added an interactive results explorer to High Performance Sandbox Benchmarks and refreshed the underlying run. It now covers 11 sandbox environments, up from 6. The harness and every raw run are still open source at starslingdev/hpc-sandbox-benchmarks.
We run StarSling's compute on these sandboxes, and we've put 500K+ sandbox jobs through them in production. These are the benchmarks we used to decide which providers to run on.
An interactive results explorer
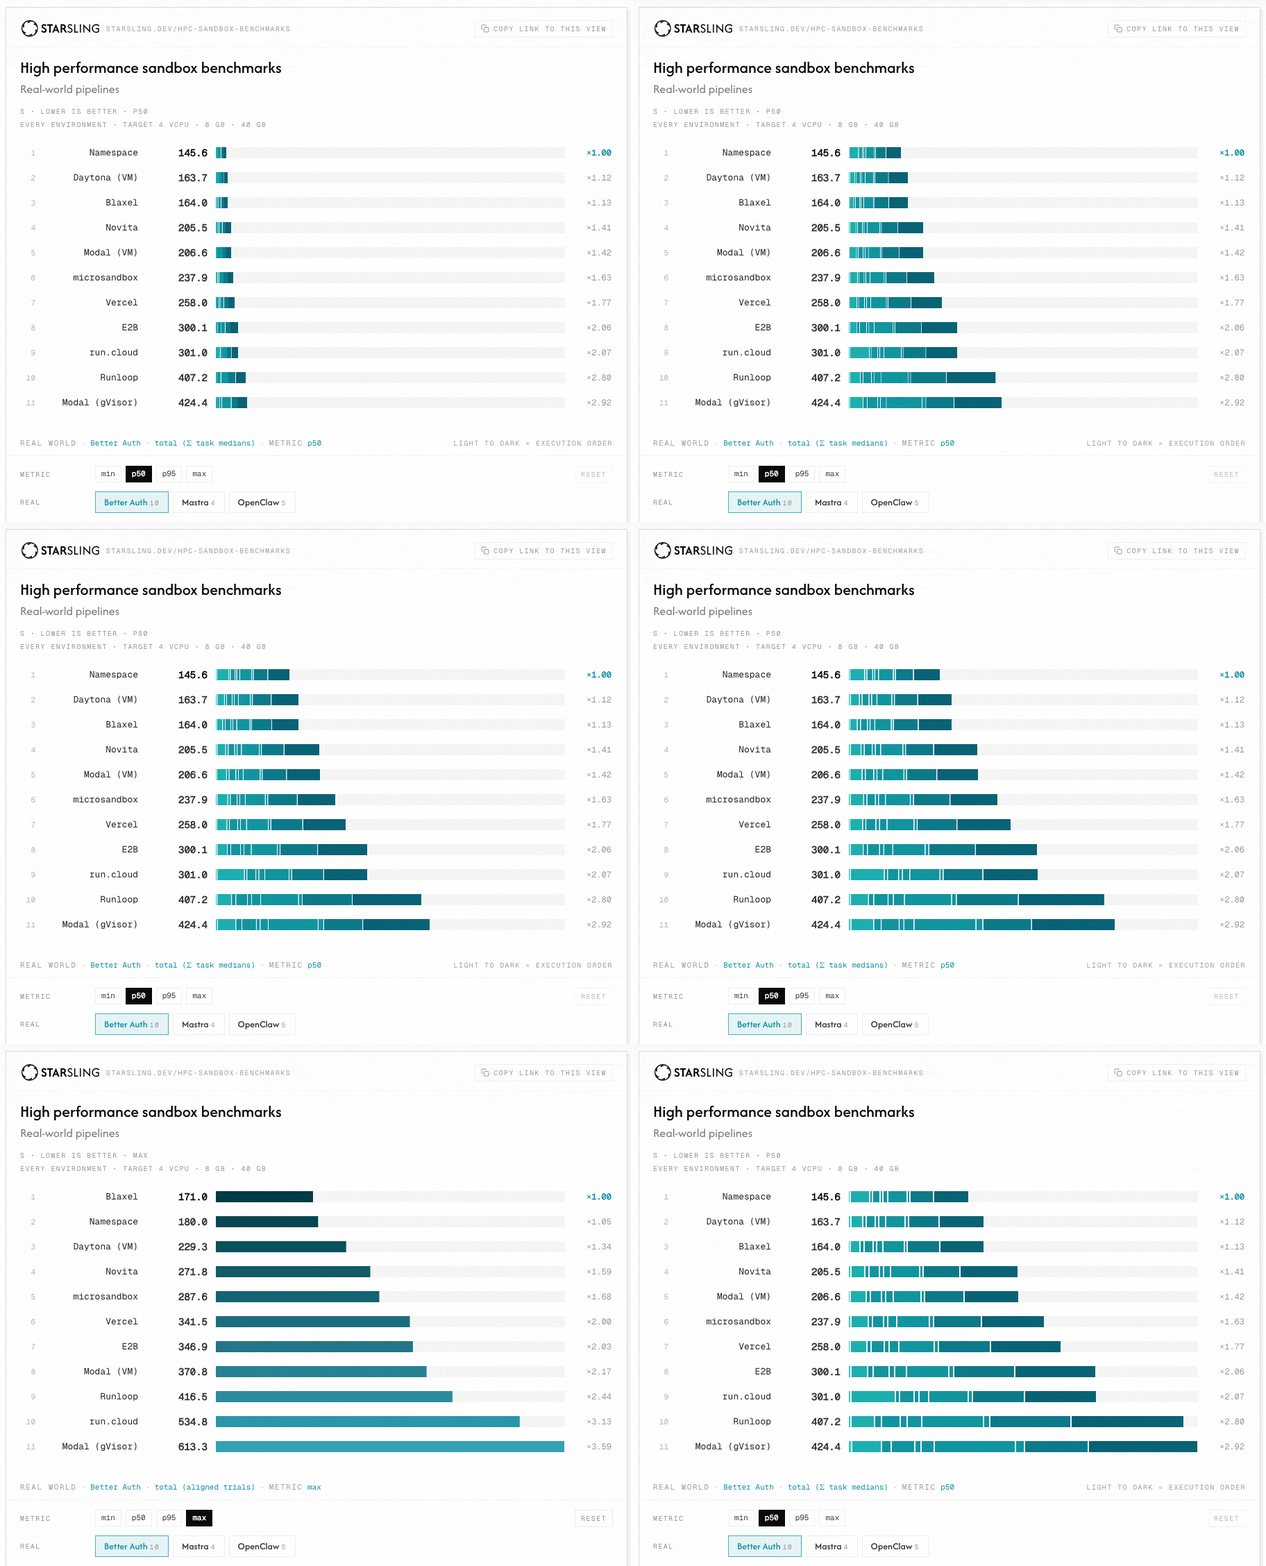
The report now opens with a results explorer. You pick a statistic (min, p50, p95, or max) and either a real-world pipeline or a synthetic benchmark family, and it ranks every environment best-first with its ratio to the leader.
It does four things:
- Switch percentile in place. The median is the headline, but p95 is what a CI queue feels on a bad draw. Toggling between them on the same metric shows which environments are consistent and which just have a good median.
- Show the distribution behind a bar. Hover or focus a row to get that environment's instance metadata and the raw sample spread.
- Jump to the full table. Select a row and it takes you to that metric in the all-metrics table.
- Share a specific view. The copy-link button gives you a URL carrying the metric and percentile you're on, so a link to p95 on OpenClaw opens on p95 on OpenClaw.
Six families are selectable: CPU, disk I/O, memory bandwidth, network, system, and the real-world pipelines.
What changed since the first run
The first run covered six environments: Blaxel, Daytona's VM, E2B, Modal's two runtimes, and Novita. This run covers eleven. All six are still there, plus five new ones:
- microsandbox
- Namespace
- run.cloud
- Runloop
- Vercel
The target spec is unchanged at 4 vCPU, 8 GB RAM, and 40 GB disk. So are the workloads: three real repository pipelines run cold through each repo's own CI tasks, plus ten Phoronix synthetic suites.
Two things are new in the data itself. You can now see min, p50, p95, and max on every measured cell, which is what makes the percentile switch possible. The run also records which host hardware each replicate sandbox landed on, so an environment whose sandboxes ran on several machine types carries a flag on its CPU row. Three environments are flagged here.
Doubling the field widened the spread. On Better-Auth's CI task matrix the same pipeline takes 145.6 s on the fastest environment and 424.4 s on the slowest, a 2.9x difference for identical work on identically requested hardware.
Precision
Every environment now reports how far apart its own replicate sandboxes landed on the same metric. This is worth reading before you weigh any ranking, because fast and consistent are different properties. The steadiest environment in this run finishes eighth of eleven on the real pipelines.
Check the results yourself
Every number on the page is recomputed from the raw run document, and a build check fails if the rendered figures and the run disagree. The methodology lists what every suite measures.
The harness and every raw run are in starslingdev/hpc-sandbox-benchmarks. Clone it and run the suites against your own workloads. The environment that wins for our CI may not be the one that wins for yours.
Open the results explorer and start with the metric you care about.
Results reflect the provider infrastructure, hardware, and regions available when the run executed.